Impact/ROI
NJMEP has been a national leader and advocate of New Jersey manufacturers for more than 20 years. Our value is provided through available services most meaningful to helping companies improve performance - in developing a company’s purpose, their processes and people.
From our national connections through NIST and the MEP network, we offer a wide range of services and initiatives to enable manufacturers to identify opportunities that will accelerate and strengthen growth and competitiveness in the global marketplace.
Our staff which includes experts from a variety of business and manufacturing sectors provides clients with a business assessment to identify areas of cost savings and areas for growth. We constantly challenge ourselves to help our clients realize significant and quantifiable benefits and impacts for their investment.
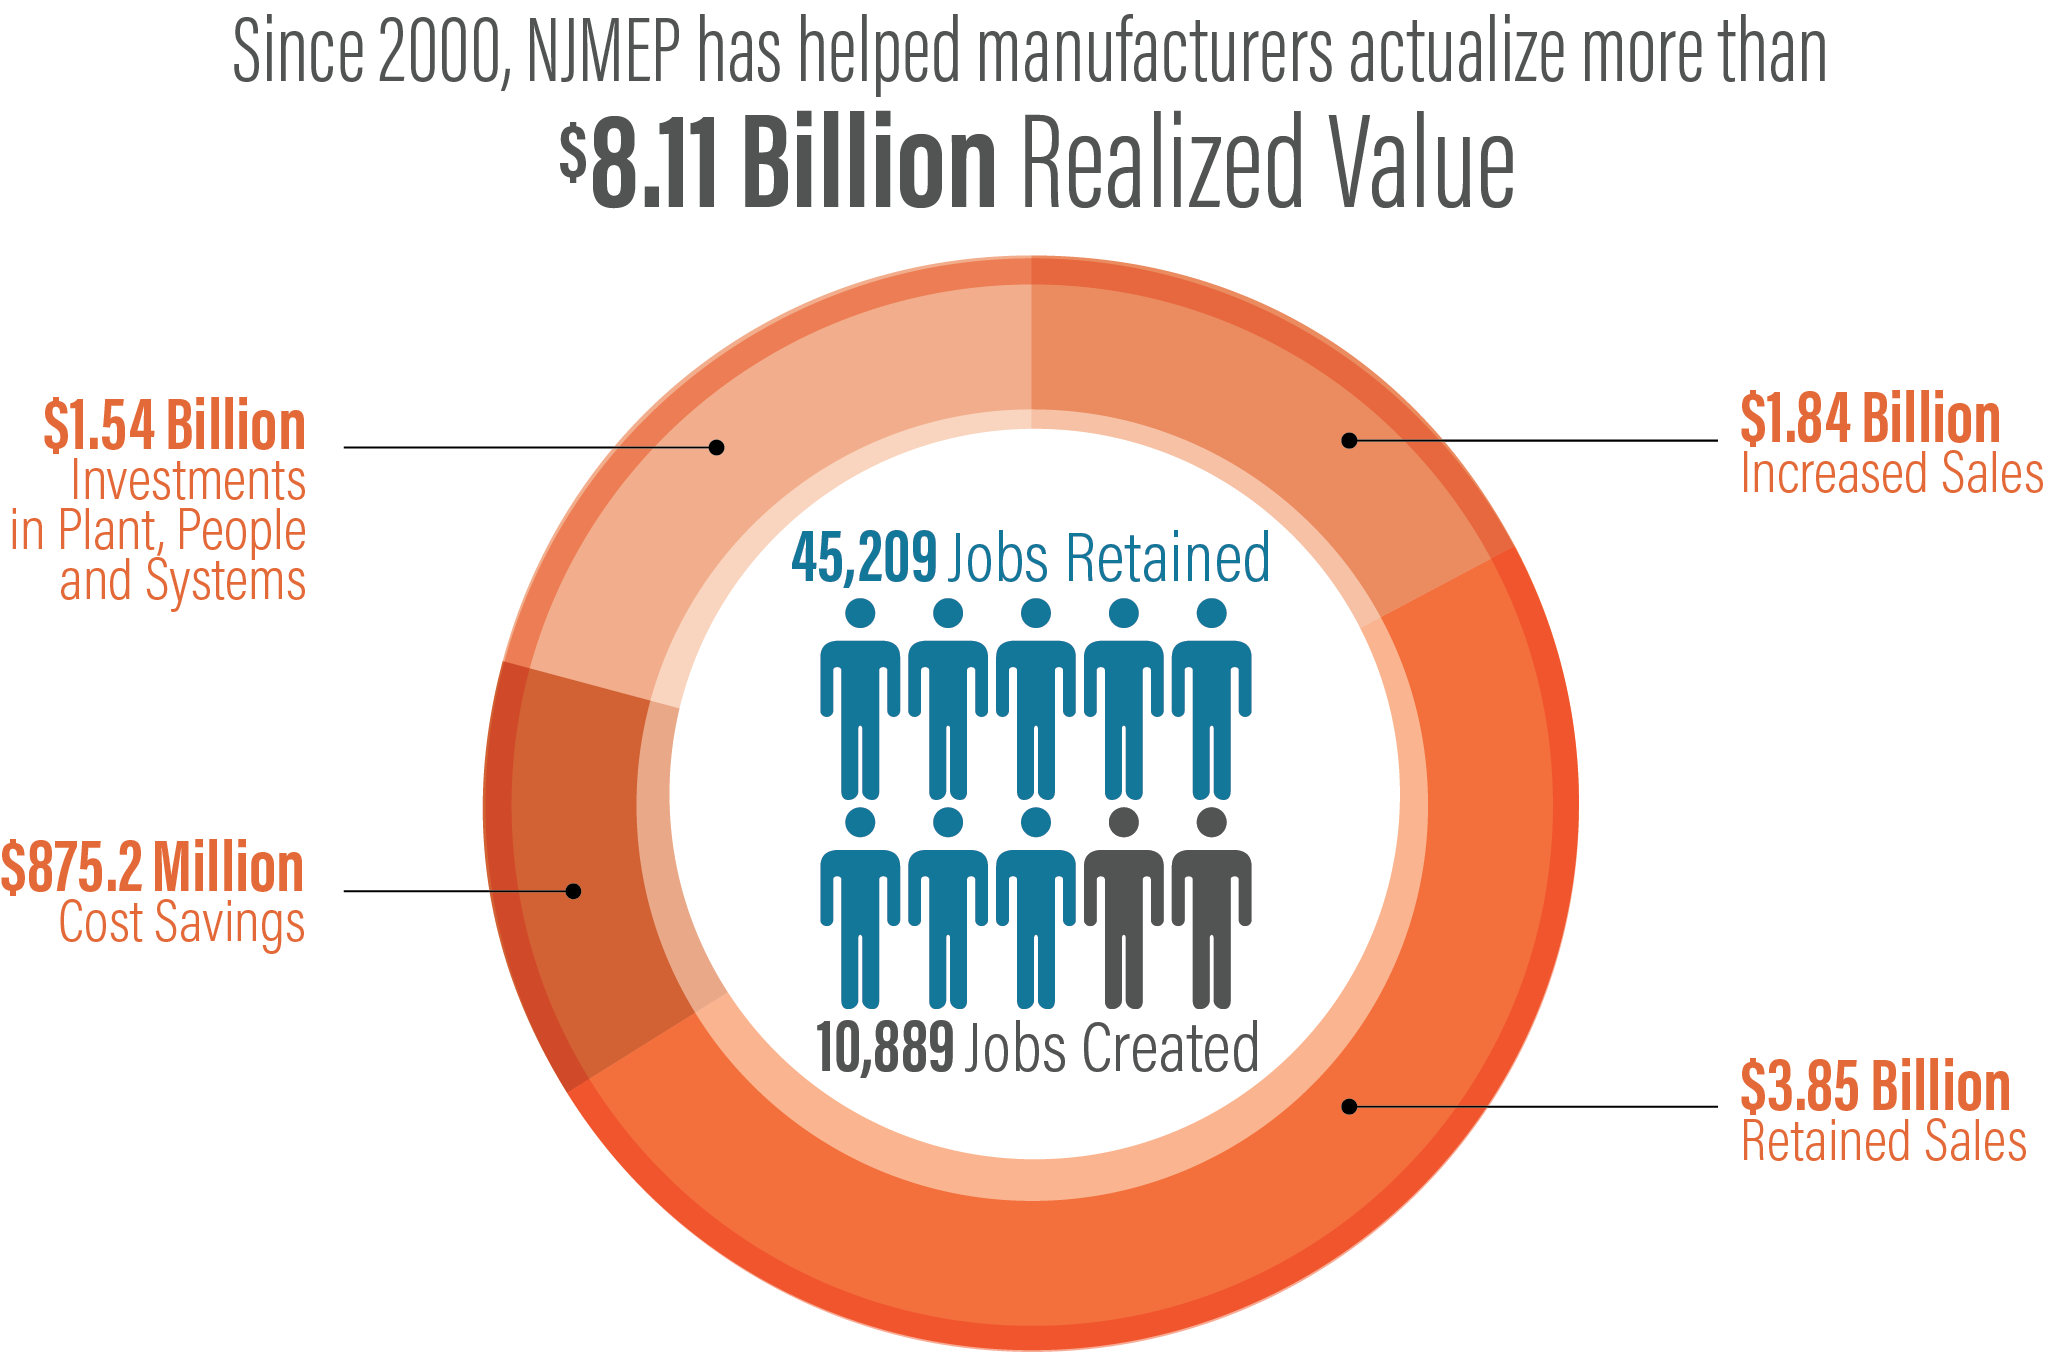
Since 2000, NJMEP has worked with thousands of manufacturers, leading to more than $5.69 billion in increased and retained sales, $875.2 million in cost savings, $1.54 billion in capital investments, and helped create and retain over 56,098 jobs. In total, NJMEP has helped manufacturers realize more than $8.11 billion in value.
NJMEP doesn’t provide training and consulting on a given topic and then leave the manufacturer on their own. We stay engaged throughout the implementation of the enabling technologies, processes or knowledge, and afterwards because experience has shown that this brings the most success.
| Calendar Year | Increased Sales (millions) | Retained Sales (millions) | Cost Savings (millions) | Investments in Plant, People and Systems (millions) | Jobs Created | Jobs Retained |
| 2024 | $73 | $208 | $17 | $56.1 | 437 | 2,750 |
| 2023 | $84.5 | $163 | $19.1 | $76.5 | 556 | 2,220 |
| 2022 | $72.2 | $237.1 | $31.7 | $63.3 | 381 | 1,792 |
| 2021 | $111.6 | $302.7 | $46.1 | $66.1 | 582 | 3,562 |
| 2020 | $137.1 | $447.6 | $312.7 | $391.2 | 740 | 4,304 |
| 2019 | $37.06 | $102.38 | $14.55 | $49.40 | 391 | 1,520 |
| 2018 | $58.85 | $150.08 | $16.33 | $66.31 | 690 | 2,235 |
| 2017 | $49.60 | $191.60 | $22.60 | $75.00 | 641 | 2,723 |
| 2016 | $95.30 | $167.70 | $20.70 | $60.08 | 578 | 2,630 |
| 2015 | $48.20 | $157.40 | $27.40 | $61.50 | 641 | 3,183 |
| 2014 | $51.10 | $133.10 | $22.30 | $56.70 | 626 | 1,897 |
| 2013 | $74.50 | $161.10 | $34.60 | $64.00 | 496 | 1,418 |
| 2012 | $52.20 | $177.90 | $35.70 | $40.30 | 464 | 1,674 |
| 2011 | $43.00 | $169.00 | $25.50 | $37.80 | 407 | 1,400 |
| 2010 | $37.00 | $197.00 | $25.10 | $36.30 | 563 | 2,376 |
| 2009 | $35.20 | $185.20 | $37.10 | $33.50 | 232 | 1,210 |
| 2008 | $52.60 | $109.60 | $27.50 | $41.70 | 355 | 1,719 |
| 2007 | $73.80 | $135.90 | $31.60 | $36.30 | 377 | 2,367 |
| 2006 | $39.60 | $84.70 | $16.70 | $18.90 | 242 | 1,280 |
| 2005 | $5.90 | $24.10 | $12.20 | $5.70 | 185 | 928 |
| 2004 | $20.90 | $31.40 | $6.40 | $12.80 | 117 | 308 |
| 2003 | $15.50 | $12.10 | $5.30 | $9.10 | 103 | 301 |
| 2002 | $14.60 | $27.00 | $9.50 | $9.40 | 144 | 371 |
| 2001 | $19.60 | $31.90 | $13.60 | $31.30 | 158 | 234 |
| 2000 | $11.90 | $30.50 | $7.40 | $9.70 | 82 | 686 |
| Total 2000 - 2024 | $1.315B | $3.638B | $839M | $1.409B | 10,188 | 45,088 |